|
After plotting the house and lot your next step is to draw in the permanent features. Examples are: garages, driveways, pools, patios, and walkways. Make sure you have precise measurements. You can use the corners of the house to verify that the features are correctly placed. |
 |
After measurements and drawings are completed to perfection your next step is to measure the pump capacity. The capacity of a pump consists of two components: the pump discharge rate and the discharge pressure. The discharge rate or otherwise known as the water flow, is measured by GPM (gallons per minute). The pressure is measured by PSI (pounds per square inch). It is necessary to measure both the discharge rate and pressure under normal operating conditions in order to properly determine how the pumping system will operate as part of your irrigation system.
A flow rate meter is the most direct method because it measures the flow rate directly in gpm. The costs of flow rate meters varies widely, ranging from about $50 for small pitot meters which measure only flow rate, to several hundred dollars for impeller meters which measure flow rate and total flow through the meter.
|

Pitot Meter
|
 |
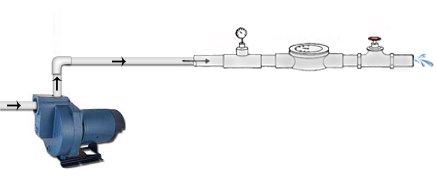
Fig. 1 Pump Capacity Measure Apparatus |
|
The discharge pressure can be measured easily and inexpensively using a standard pressure gauge. Gauges are available in 15, 30, 60 and 100 psi ranges for about $10. Select a pressure gauge that is accurate within the range of pressures that the pump can produce. For example, if your pump can produce a maximum pressure of 50 psi then select a 60-psi gauge. |

Pressure Gauge
|
Measuring Head-Discharge Curves
For Centrifugal and Turbine Pumps, the discharge rate depends on the pressure that the pump operates against. If the pressure is high, the discharge rate will be low, and conversely, if the pressure is low, the discharge rate will be high. The relationship between pressure and discharge rate is known as the head-discharge curve for the pump. The curve may be different for each pump because of the pump characteristics and many site-specific factors.
An apparatus which can be used to measure a pump head-discharge curve is show above in Figure 1. It consists of a pressure gauge, flow meter, and regulating valve installed on a section of straight pipe.
A pipe fitting or connecting hose is needed so that the head-discharge measurement apparatus can be connected to the pump discharge. All components must be sized and pressure-rated to permit the measurement of the complete range of pressures and discharge rates that the pump produces. |
Measure the head-discharge curve in the following steps: |
 |
Connect the head-discharge apparatus to the pump discharge with sufficient lengths of straight pipe to obtain an accurate flow rate measurement. |
| |
|
 |
Operate the pump to remove air from the pump and pipelines and to reach normal operating conditions. |

|
Slowly close the regulating valve and measure the shut-off head. The shut-off head is the maximum pressure that the pump deliverswhen there is no flow. Record this pressure.
Do not leave the pump operating under no-flow conditions for long periods of time, as this may overheat and damage the pump. |
 |
Open the regulating valve a small amount and mesure the pressure and flow rate at this valve setting. |
 |
 |
Repeat step 4 at other valve openings until the valve is completely open. Valve adjustments should be made to produce at least 6-8 pressure-discharge points over the flow range from completely closed to wide open. |
It is convenient to use the pressure gauge to uniformly distribute the measured data points over the range that the pump can produce. For example, assume that the pump shut-off head was 45 psi. Then, adjust the regulating valve to set 5 psi changes in pressure as the valve is opened. First, open
the valve until the pressure drops to 40 psi and measure the discharge rate at that pressure. Then, open the valve until the pressure drops to 35 psi, etc., until the valve is completely open and the final pressure is 0 or nearly 0 psi. The final pressure may not reach 0 depending on the design of your head-discharge apparatus.
Example Head-Discharge Data
Pressure (psi) |
Discharge (gpm) |
45 |
0.0 |
40 |
7.1 |
35 |
13.0 |
30 |
18.3 |
25 |
22.1 |
20 |
25.2 |
15 |
27.0 |
10 |
28.6 |
5 |
29.9 |
1.5 |
30.4 |
|
Table 1. Example of Pump Head Discharge Data
|
An example set of head-discharge data is shown in Table 1. These data were developed following theprevious example in which the shutoff head was assumed to be 45 psi, and flow rates were measured at 5 psi increments until the regulating valve was completely open. This measurement strategy produced a total of 10 data points.
Figure 2 is a graph of the data show in Table 1. Notice that the ralationship between pressure and discharge rate is a curve rather than a straight line. This is the reason that at least 6-8 data points are necessary to accurately describe this relationship.
 |
Figure 2. ExamplePump Capacity Curve Using Data from Table 1
|
|
From the data shown in table 1 and figure 3, the designer can read the information needed to properly design an irrigation system using this pump. For example, if a sprinkler system requires 35 psi at the pump, then 13 gpm is the maximum flow rate that is available from this pump. If the system requires more than 13 gpm, then it will need to be designed and operated in zones so that no zone requires more than 13 gpm.
As another example, if a drip irrigation system requires 20 psi from the pump, then this pump can deliver 25.2 gpm at this pressure.

|